영국계리사회(IFoA)의 보험통계 연구센터 (ARC)는 2019년 6월 24일 '경제적 사고와 계리 실무(Economic Thought and Actuarial Practice)'에 관한 보고서 초안을 발표했다.
이 보고서는 보험계리사와 경제 전문가의 경제적 사고에 관한 광범위한 토론을 배경으로 다양한 최근 견해를 제시하고 있는데, 경제적 사고의 전통적 개념이 어떻게 변화하고 있는지, 그리고 이러한 변화가 장기투자 및 리스크에 대한 접근법에 미칠 수있는 영향에 대해 이야기하고 있다.
Leeds University Business School의 Iain Clacher 박사는 경제적 사고가 대다수 계리사의 업무에 매우 중요한 역할을 한다는 것을 전제하고, 계리사가 경제적 사고를 계리 실무에 어떻게 적용하고, 그들의 조언이 어떻게 영향을 미칠 수 있는지 조사했다.
한편, 향후 이 초안을 바탕으로 더 광범위한 전문가와 협력하여 더 많은 조사를 할 계획이라고 한다.
투자회사가 대학생에게 학자금을 주고 그학생의 미래 수입을 증권으로 취득한다. 그 대학생이 취업한 후 발생하는 급여에서 일정 몫(stake)을 직접 받는데, 그 학생(피투자자)가 실업일때는 못받게된다.
미국 Purdue University에서 학부생을 대상으로 진행되고 있다는데, 보험의 원리가 흠뻑 스며들어가 있다. 결국 실업률이라는 통계가 보험의 사망률을 대신하는 것 같은데, 영어 전공자에게는 취업후 매월 급여의 4.52%를 약10년(116개월) 동안 회수하는 조건으로 1만달러(약1140만원)을 투자한다. 한편, 취업률이 높은 컴공과 전공자에게는 훨씬 좋은 조건인 2.6% 88개월이다.
College Grads Sell Stakes in Themselves to Wall Street
Instead of taking out loans, students can agree to hand over part of their future earnings in return for investment.
By
Claire Boston
2019년 4월 9일 오후 6:00
Amy Wroblewski
Photographer: Maura Friedman for Bloomberg Businessweek
To pay for college, Amy Wroblewski sold a piece of her future. Every month, for eight-and-a-half years, she must turn over a set percentage of her salary to investors. Today, about a year after graduation, Wroblewski makes $50,000 a year as a higher education recruiter in Winchester, Va. So the cut comes to $279 a month, less than her car payment.
If the 23-year-old becomes a star in her field, she could pay twice as much. If she loses her job, she won’t have to pay anything, and investors will be out of luck until she finds work.
Wroblewski struck this unusual deal as an undergraduate at public Purdue University in West Lafayette, Ind. To fund part of the cost of her degree in strategy and organizational management, she sidestepped the common source of money, a student loan. Instead, she agreed to hand over part of her future earnings through a new kind of financial instrument called an income-sharing agreement, or ISA. In a sense, financiers are transforming student debtors into stock investments, with much of the same risk and, ideally, return.
In Wall Street terms, Wroblewski, a first-generation college student, is more small-company stock than Microsoft. Her mother works as a waitress; her father, as a quality control inspector in a car dealership’s body shop. With a strong work ethic, Wroblewski always held down at least two part-time jobs in school, working as a Purdue teaching assistant, a Target cashier, and an Amazon seasonal worker. Showing potential for leadership—not to mention earnings—she rose to vice president of Delta Sigma Pi, a business fraternity.
Those qualities impressed a company called Vemo Education, which vets students at Purdue and a handful of other schools on behalf of potential investors. More important, perhaps, Wroblewski believes in herself and her ability to make good on the contract. “Even with all my other loans, I knew I could make it work,” says Wroblewski.
Americans owe $1.5 trillion in higher education debt, a burden that weighs down their dreams and the U.S. economy. The Federal Reserve says millennials are now less likely to buy homes than young people were in 2005, and even senior citizens find themselves still making payments on their student loans. Wall Street sees the crisis as an opportunity. College graduates on average earn $1 million more over their lifetimes. Investors could capture some of that wage premium for themselves..
Total Student Loan Debt Outstanding
Data: Federal Reserve Bank of New York
“I envision a whole new equity market for higher education in the next five years where today there’s only debt,” says Chuck Trafton, who runs hedge fund FlowPoint Capital Partners LP, which has invested in ISAs, including Purdue’s. ISA experts say they have fielded calls from some of the world's largest investment managers that are considering investing in the contracts. And Tony James, executive vice chairman of money manager Blackstone Group LP, formed the Education Finance Institute to help schools study and develop ISAs.
For now, the market for income-sharing agreements can be measured in the tens of millions, a tiny sum compared with the $170 billion in outstanding asset-backed securities created from student loans. Only some schools let outside investment firms buy a stake in students. Others seek out individual donors, mostly wealthy alumni, or use money from their own endowments.
Along with Purdue, which started its program in 2016, some smaller private schools such as Lackawanna College in Scranton, Pa., and Norwich University in Vermont are offering ISAs. The University of Utah recently announced a pilot plan.
ISAs raise all kinds of questions. How many students will lose their jobs and be unable to pay? How much should Wall Street demand as compensation for the risk? Investors typically ask for a smaller slice from students with more lucrative majors. At Purdue, for example, English majors borrowing $10,000 pay 4.52 percent of their future income over nearly 10 years; chemical engineers, 2.57 percent in a bit over seven years.
Major Decision
Estimated payment schedule for a $10,000 income-share agreement made through Purdue University in a student’s senior year, by major
Data: Purdue University, Vemo Education
Purdue set up its program to be competitive with many student loans for the typical borrower. Consider a junior economics major who needs $10,000. Through a private loan, she’d likely pay $146 a month, or $17,576 over the course of 10 years. Through an ISA, a student with a starting salary of $47,000, Purdue’s estimate for its 2020 economics graduates, would pay $15,673, assuming 3.8 percent annual salary increases. That would be a good deal. But, if she found a $60,000-a-year job, she’d have to fork over $20,010.
Financial firms and for-profit colleges have been known to prey on college students’ financial naiveté to sell them high-priced private student loans, rather than steer them toward more favorable government-backed ones. While schools offering ISAs say they will offer them only after government loans with the most favorable terms are exhausted, some students may end up again with regrets.
“There’s a level of enthusiasm that’s overstated,” says Julie Margetta Morgan, a fellow who studies higher education at the Roosevelt Institute, a think tank focused on reducing income inequality. “It’s pretty darn near impossible to say whether an ISA is better or worse for an individual.” Morgan dislikes that ISAs require arbitration, which means students give up their right to sue in court.
The last big ISA experiment—at Yale University in the 1970s—ended up as a cautionary tale. Yale pooled all borrowers, and they owed the school a percentage of their incomes for 35 years, or until everyone paid back what they owed. The idea was that graduates who ended up with high-paying jobs in finance would subsidize those who chose public service.
But many students defaulted, leaving the remaining borrowers on the hook longer than they’d anticipated. Other wealthier students exited the pools via large one-time buyout payments. The remaining students tended to be lower-income. Some stopped paying altogether. Yale ultimately bailed out the borrowers, winding down the whole program in 2001.
Juan Leon, who sells business jets for Dassault Aviation SA, graduated from Yale in 1974 with a degree in urban studies. He borrowed $1,500 through the college’s “Tuition Postponement Option.” By the late 1990s, he’d paid back $8,000. “We didn’t read the fine print,” Leon says. “It was quite, quite onerous.”
Students have more protection under newer plans. Purdue, for example, caps total payments at 2.5 times what a student borrowed, so the most successful don’t feel gouged. And students making less than $20,000 a year won’t be charged at all, as long as they are working full time or seeking work. Those who are working part time or not seeking work will only have their payments deferred, which means that they’ll owe for a longer period of time.
Purdue has arranged more than 700 contracts worth $9.5 million and closed two investment funds totaling $17 million. David Cooper, Purdue’s chief investment officer, helped to develop the program and pitch it to investors after almost a decade of overseeing investments for Indiana’s retirement system. He says the funds are drawing more interest now that the oldest contracts have over 20 months of repayment data. “We feel like we’ve got the pricing for the students at a pretty good spot,” Cooper says. “At the same time, it’s a reasonable return for the investors.”
Purdue’s early funds attracted investments from wealthy individuals, as well as nonprofit Strada Education Network and INvestEd, a nonprofit lender and financial literacy organization in Indiana. Cooper says ISAs may make most sense for socially conscious investors, but he points out that even funds seeking lofty profits might one day be interested if they can juice returns with leverage.
Charlotte Hebert, 23, who graduated from Purdue in 2017, has mixed feelings about the $27,000 she took out from an ISA to pay for her senior-year costs. A professional writing major, she’s required to shell out 10 percent of her income for the term of the deal. That’s about 2.5 percentage points more than an engineer would pay. The daughter of a teacher and a nurse, she makes about $38,000 a year as a technical writer for an engineering firm in Lafayette, Ind.
She pays investors $312 a month. “I don’t think it’s the perfect solution,” Hebert says. “I am of the opinion that in a society where most of its workers need a college education, nobody should be paying this much to be what is considered a functional member of society.”
The most valuable college major? Actuarial science
Riley GriffinBloomberg News
Taking on student debt is a financial risk, but those those who study such risks are best positioned to pay it off after graduation.
A Bankrate.com report released on Monday ranked actuarial science - the formal term for the study of insurance - the most valuable college major. Actuarial-science majors earn an average annual salary of $108,658 and have a better-than-average unemployment rate of only 2.3 percent. And at a time when student debt has hit a record high, these graduates are less likely to incur the added expense of additional schooling and delayed earning potential. Fewer than 1 in 4 graduates pursue advanced degrees.
"The actuarial science profession is interesting because students don't need advanced degrees to gain livable wages, but instead are certified through a series of exams overseen by the industry's professional organizations," said Bankrate.com analyst Adrian Garcia in an interview. "Students typically pass one to two of these exams while in school and then go on and complete others while working, earning raises and bonuses as they pass."
The study ranked 162 majors with labor forces of at least 15,000 people based on average annual income, employment status and whether those graduates went on to pursue a higher degree within 12 months. Income accounted for 70 percent of the weighted ranking, unemployment for 20 percent, and career paths that did not demand additional education for 10 percent. The data were derived from the U.S. Census Bureau's 2016 American Community Survey.
Recent actuarial-science graduates are entering the industry at an opportune moment. The U.S. property and casualty insurance industry took in $18 billion in net profit, even as the country sustained heavy losses from natural catastrophes such as hurricanes Harvey, Irma and Maria, according to the National Association for Insurance Commissioners. But that number is expected to increase in 2018 thanks to favorable interest rates, shows the S&P Global Market Intelligence report. Health-care premiums are also on the rise as many insurers seek double-digit percentage increases in monthly costs for individual medical plans in 2019.
Science, technology, engineering and mathematics degrees continue to offer the best postgraduate prospects to college students, the study found. Zoology, nuclear engineering, premedical programs and applied mathematics dominated the five most valuable degrees, offering graduates low rates of unemployment and six-figure salaries.
But the prospect of a high salary doesn't always win out. Petroleum-engineering graduates boast the most lucrative average salary, topping out at $124,448, but fail to crack the top of the list because of an excessively high 7.9 percent unemployment rate.
The only students faring worse than fine arts degree holders are niche fine arts degree holders: Graduates with degrees outside the traditional buckets of art, theater, music or creative writing earn the second-lowest average annual salary of $40,855. At a whopping 9.1 percent, they also have the highest unemployment rate of any major.
"At the end of the day," Garcia said, "you have to balance being practical and following your passion."
Using member-level predictive models to calculate IBNR reservesANDERS LARSON, JACK LEEMHUIS AND MICHAEL NIEMERGJune/July 2018
Predictive models have the potential to transform many aspects of traditional actuarial practice and change the way actuaries manage and think about risk. One common actuarial task where modern predictive models are not commonly used is the calculation of incurred but not reported (IBNR) reserves. Rather, IBNR has historically been calculated for pools of members using aggregate methods that utilize high-level assumptions without any sophisticated consideration of the risk factors of the individual members within the pool. However, by incorporating these risk factors into a predictive model, there is the potential to develop an informative alternative to the traditional actuarial approach. In this article, we’ll consider how a predictive model might be built to estimate IBNR at the member level. To demonstrate its efficacy, we’ll consider a case study from the group health care market.
IBNR Defined
Let’s first define what IBNR is. Essentially, IBNR is an estimate of the amount of claim dollars outstanding for events that have already happened but have not yet been reported to the risk-bearing entity.1 For instance, if you break your arm and go to the emergency room, you will generate a claim on that date. Until you (or your provider) report that claim, your insurance company does not know about it. However, your insurance company is still liable for the claim. In fact, the risk-bearing entity is responsible for all incurred and unreported claims like this across its pool, and so it must set funds aside in its financial statements for the estimated amount of these payments. The challenge here is obvious: Because the insurance company doesn’t even know that you’ve gone to the hospital, the IBNR reserves held on its financial statement will always need to be estimated.
Traditional actuarial methods for IBNR estimation have many flavors, but they have largely revolved around aggregate estimations for entire pools of members. One traditional actuarial method, which we’ll refer to as the completion factor method, looks at the claims already received and estimates what percentage of incurred claims are believed to already be reported. This value is our completion factor. With an estimate of the total incurred claim cost, then the calculation of IBNR is as straightforward as subtracting the claims already reported from the total incurred claim costs, as shown in Figure 1. All the science and art of this method of IBNR estimation revolve around deriving good estimates for how complete the claims are for a given month.
Figure 1: Application of Completion Factor Method to Estimate IBNR
A
B
C = A / B
D = C–A
Incurred Month
Claims Reported to Date
Assumed Completion Factor
Estimated Final Incurred Claims
IBNR
December 2017
$1,000,000
40.0%
$2,500,000
$1,500,000
November 2017
$1,200,000
60.0%
$2,000,000
$800,000
October 2017
$900,000
90.0%
$1,000,000
$100,000
September 2017
$1,000,000
100.0%
$1,000,000
$0
An alternative actuarial approach, which we’ll refer to as the projection method, is to estimate the average incurred claim cost per member with no consideration of the amount of claims already reported. This is typically done by using the average incurred claim costs per member from a time period that is assumed to be 100 percent complete (or close to complete).2 With an estimate of the total incurred claim cost per member in hand, we merely need to take the difference between this value and the average amount of the claims already reported per member to get the IBNR expressed on a per-member basis. Multiplying this value by the total number of members in the pool gives us our final IBNR estimate.
The projection method is a common approach for very recent months, and it relies on the assumption that the claims that have been reported to date in those recent months are not a good predictor of total incurred claims. The completion factor method is more common in months where the claim payments are assumed to be more mature.
Why Use Predictive Models at the Member Level?
Traditional methods like the previous example are technically predictive models, but they treat all individual risks the same. The benefit of such an approach is its simplicity and tractability. However, the underlying assumption that every person in the pool has the same historical payment pattern and propensity to have incurred and unreported claims seems unlikely.
An alternative to these traditional methods is to use predictive models at the member level. One of the strengths of predictive models is their ability to take high-dimensional data sets within which to segment and attribute risk more accurately, while appropriately handling any complex relationships between our prediction and the variables the model uses to make that prediction. Instead of relying upon aggregate completion patterns, predictive models can estimate IBNR for each member directly. These member-level IBNR predictions can then be summed together into an aggregate reserve amount for an entire employer group or pool of business.
Why use predictive analytics in this fashion? The biggest potential gain is in the accuracy of the estimate. IBNR can fluctuate wildly, particularly for small groups or payers with unstable payment patterns, and any additional pickup in predictive power can be helpful in estimation. An additional drawback of traditional methods is that it can often be difficult to develop IBNR estimates for different subpopulations. For instance, suppose you work at a small insurance company and you are interested in reviewing the incurred claims by month, including IBNR, for individually insured members ages 55 to 64 in a particular geographic region. Using a traditional approach, there would be two options:
Develop an IBNR estimate based on payment patterns observed specifically for this cohort. This involves additional effort, and the credibility of the estimates could be a concern if the population is small.
Apply completion factors developed from a larger pool of members. This approach is simpler, but it can also be problematic if the underlying payment pattern for this cohort is different from the larger pool.
Predictive analytics methods applied at the member level can solve this challenge by leveraging the credibility of the entire pool of members while accurately reflecting the risk characteristics embedded within any slice of the data. By producing estimates for each individual member, the estimates can be aggregated to any desired level.
The added sophistication of member-level predictive models is not free. Generally, estimating IBNR using aggregate methods can be done in a spreadsheet application after doing some data preprocessing in a language of your choice. The minimum data requirements for the completion factor method are simply a summary of claims paid for each combination of incurred month and reported month in the historical period (known as a lag triangle). Building predictive models at the member level is more demanding. First, you need to capture all the data elements required for your predictive model that perhaps you weren’t capturing at the individual level before (demographics, geography, risk scores, etc.). Second, you need to manipulate this larger data set into a format that can be fed into modeling software. Once the data is ready, you need to actually be scoring all these members on a platform capable of making predictions using a predictive model before finally aggregating and interpreting results.
Case Study: Our Model Building Approach
To assess the potential benefits of using predictive analytics to calculate IBNR at the member level, we performed an illustrative case study from a large, multiple-payer data set for 10 different employer groups ranging in size from approximately 400 to 7,000 members. In our evaluation, we looked at the performance of two popular machine learning methods: penalized regression and gradient boosting decision trees.3
We built separate models for each incurred month. For instance, one model was strictly focused on predicting IBNR in the most recent month, while a separate model was focused on predicting IBNR in the previous month. To train the models, we included a rich variety of features, including historical payment information (by incurred month and paid month), as well as demographic and clinical information such as age, gender and risk score. We also included some “leading indicator” features that helped the model identify potential large payments that had been incurred. For instance, one of these features indicated that a member had incurred a professional claim at an inpatient or outpatient facility during a given month, yet no facility claim had been reported for that month. During a hospital visit, there are typically separate bills from the facility and from the physician (or physicians). The physician (professional) bill is often processed more quickly and is generally much less expensive than the facility bill. The presence of only the professional bill is a strong indicator that there is a large claim that is yet to be reported.
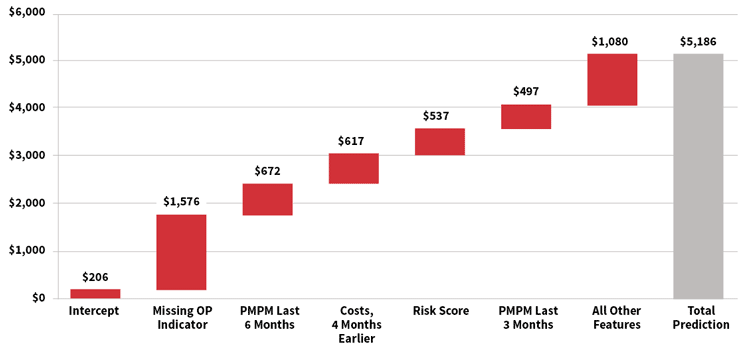
For many modern machine learning algorithms, the relationships between features and predicted values can be complex. The waterfall chart in Figure 2 is a representation of the prediction development for a single member’s IBNR estimate for the most recent month, using a gradient boosting machine. For this member, the model started with a baseline estimate of $206, but this increased by approximately $1,576 as a result of the member having a “missing outpatient claim” (as described earlier). Other features pushed the prediction even higher, including high monthly costs over the past six months and a high risk score. Ultimately, the model predicted an IBNR of $5,186 for this member.
Figure 2: Illustration of Predicted IBNR for Individual Member, Gradient Boosting Machine
Case Study: How Accurate Were Our Models?
To keep our case study simple, our models only predicted claims that were incurred within the three months prior to the valuation date because these months constitute the bulk of the reserve. To evaluate the accuracy of our models, we split the data into two sets: a training set and the testing set. The model was built on the training set while the testing set was withheld for model evaluation and to ensure we weren’t overfitting.
One of the most important considerations in building a predictive model is which variables to include.
To estimate overall performance, we compared the 10 group-level models for each algorithm to two traditional methods. We then compared the predicted results to the actual IBNR for each method or model, and we calculated the aggregate error across all groups, the average absolute percentage error for each group, and the standard deviation of the percentage error across the groups. These values can be seen in Figure 3. Overall, the gradient boosting decision tree model and the penalized regression model estimated the overall IBNR more accurately and had less variation than the traditional methods. These results suggest that predictive models have the potential to increase the accuracy of reserve estimates. We also found that the member-level predictions from the predictive models generally had a 30 percent to 50 percent correlation with actual results, compared with 20 percent to 30 percent when applying the group-level completion factors to individual members. The member-level correlation statistics are more complicated to aggregate across groups and lag months, so we excluded them from Figure 3.
Figure 3: Error Metrics for Traditional Methods and Predictive Models
Traditional Methods
Aggregate Percentage Error
Average Absolute Percentage Error
Standard Deviation
Completion Factor
–3.6%
42.8%
72%
Projection Method
8.3%
43.2%
47%
Predictive Models
Gradient Boosting Decision Tree
1.4%
24.8%
29%
Penalized Regression
–0.1%
27.1%
34%
Considerations
Using predictive analytics for the estimation of IBNR does not mean that actuarial judgment is no longer needed. Beyond the expertise needed in crafting the models themselves, adjustments to IBNR should still be made outside the model or as offsets within the modeling process. These adjustments can include handling new entrants without historical data, claim trends, or any staffing or technological considerations that could impact the backlog of claims.
One of the most important considerations in building a predictive model is which variables to include. Most of the increases in predictive power will not come from more powerful or refined techniques, but rather from more carefully considered and richer input data. For health care, some more obvious variables to consider (when available) are age, gender, plan design and geography of the member. In addition, the temporal nature of IBNR makes the timing of when things happen a key consideration. In designing variables for the model, this should be exploited where possible. For instance, the reporting of less expensive drug claims may precede more expensive inpatient and outpatient claims, or high claims in a prior period may indicate more claims are still outstanding.
Given enough feature creation and enough volume of data, a well-crafted predictive model should be able to discern the most pertinent relationships. As an example of some possible relationships a predictive model might uncover, consider Figure 4. In the first table, we see two variables and their joint impact on the IBNR within our case study (for simplicity we are only considering the amount of unreported claims in the month prior to the valuation date and paid within the next month, which we denote L0). The first variable is the member’s average monthly claims over the past year. The other variable is the “missing inpatient” indicator discussed earlier. Similarly, in the second table in Figure 4, we see another joint relationship that can stratify risk. This time the relationship is between the claims already paid in L0 and the risk score of the member.
Figure 4: Average IBNR in Lag 0 by Certain Key Features
Missing IP Indicator
Prior Year’s Claims PMPM
Yes
No
$0–$200
$12,612
$92
$200–$400
$10,152
$316
$400–$600
$15,103
$391
$600–$800
$14,302
$473
$800–$1,000
$17,017
$530
$1,000–$10,000,000
$19,831
$1,545
Risk Score
Claims Paid in L0
0–0.5
0.5–1.0
1.0–2.0
2.0+
$0–$1,000
$98
$157
$217
$757
$1,000–$2,500
$1,591
$1,595
$2,408
$5,374
$2,500–$10,000
$2,170
$2,492
$2,029
$8,361
$10,000–$10,000,000
$2,231
$2,934
$4,954
$16,225
The values shown in each cell represent the average observed IBNR for the most recent incurred month in our training data. As we can see in each chart, these variables are all strongly correlated with IBNR, but together we can stratify the risk more accurately than we can in isolation.
Before involving predictive models in your reserving process, many practical considerations are involved. The first and foremost should be a good understanding of the problem you are hoping to solve. While we mention two possible benefits to using predictive models—increased accuracy of the estimates and more accurate IBNR attribution to individual members within the pool—these benefits may not hold in all cases, depending on the availability of data and the line of business. For a list of potential considerations, see Figure 5.
Figure 5: Practical Considerations Before Using Predictive Models for IBNR
How will you define success for the endeavor?
What kind and quality of data do you have?
Will you need access to new data fields not currently used in the reserving process?
Do you have access to modeling so ware?
Do you have the expertise to create and deploy a predictive model?
Can you obtain the data and generate predictions fast enough to meet valuation timelines?
Can the results be explained to auditors and key stakeholders?
One thing to keep in mind is that member-level predictive models need not completely replace traditional actuarial methods to be valuable. In fact, the completion factor method and the projection method described are often blended in practice. IBNR estimates created by member-level predictive models can be similarly blended with any traditional approach. They could also be used not for the results directly, but instead as a way to help understand the drivers of changing IBNR values. Regardless, until enough comfort and sophistication with predictive models is established, the most prudent course of action for any actuary is to do rigorous back-testing and results monitoring before replacing any traditional methods.
Conclusion
Overall, our findings indicate that using predictive models for IBNR estimation is promising. However, our analysis is not definitive; given the volatility in IBNR estimates and the sample size we tested, further research is warranted before concluding that predictive modeling techniques are superior to traditional methods. However, predictive analytics methods need not completely supplant traditional IBNR methods to be valuable. Instead, and more likely, the two approaches can supplement and complement each other. What our analysis does suggest is that this is a productive endeavor to explore. By incorporating predictive models into traditional actuarial methods we might not find the crystal ball that we seek, but with the steady incremental improvements it allows us, we can help advance actuarial practice.
1. This differs slightly from incurred but not paid (IBNP) reserves, which would also include claims that have been reported but not yet paid. Throughout this article we use the term IBNR, although the same approach could be applied to IBNP reserves.
2. Actuaries often make additional adjustments to this historical cost, including applying an assumed trend and adjusting for seasonality or the number of working days per month.
3. James, Gareth, Daniela Witten, Trevor Hastie, and Robert Tibshirani. 2013. An Introduction to Statistical Learning: With Applications in R. New York: Springer.
The current product structure of the standalone, fully-guaranteed individual critical illness insurance product was launched in Canada more than 20 years ago. Yet penetration remains low at 3%. Scientific advances and next-generation medical diagnostics could undermine the viability of current CI products due to heightened risk of over-diagnoses and anti-selection. Could changing the current long-term guaranteed model benefit consumers and insurers in Canada alike?