검색결과 리스트
보험에 해당되는 글 3건
- 2019.07.27 장수리스크와 젊은 세대의 저축
- 2018.08.25 부모 사망후 상속세를 8년후에 계산해도 되는 곳에서 벌어지는 일은?
- 2018.07.26 미보고발생손해액, IBNR의 처음과 끝
글
장수리스크와 젊은 세대의 저축
장수리스크는 우리가 측정할 수 없을 정도의 속도로 가속화되고 있다. 몇몇 인구학자들의 말에 따르면 지금 태어나는 사람은 200세까지 생존한다고 한다.
2008년 금융위기때 깨진 자금이 회복되지 못한 상태에서 나날이 증가하는 생활비를 감당할 만큼 충분한 은퇴자금을 모으지 못했고, 회사가 내주는 건강보험료 등의 혜택을 유지하고 싶어하기에 많은 사람들이 55세 이후에도 은퇴를 늦추며 계속 일하려고한다.
이런 상태임에도 미국의 35세 이하의 젊은 세대들은 리스크 회피적이어서 주식투자 등에 소극적이다.
와튼스쿨 연금연구소(Wharton School Pension Research Council) 사람들의 이야기입니다.
Living Longer, Saving Less: What it Will Mean for Retirement
Jul 22, 2019

To ponder preparing for retirement in the U.S. these days depends very much upon who is doing the pondering. On the one hand, there is great freedom over the when and how of it. Some retire and find a second career, or shift into a public-service phase of life. Others are choosing to never retire at all.
On the other hand, many never get the luxury of choice. Age discrimination makes finding or keeping a job after 55 harder than ever, and a surprisingly large slice of the population hasn’t set aside an adequate nest egg.
Many might be ready for retirement, but it’s not at all clear that retirement is ready for them.
“Longevity is increasing around the world faster than many of us can fathom. In fact, demographers say the baby who will live to be 200 has already been born. This perspective can make insurance and health care providers blanch, as most are not yet thinking about how to manage truly consequential longevity risk,” says Olivia S. Mitchell, Wharton professor of business economics and public policy, and executive director of the school’s Pension Research Council.
Moreover, the mechanisms intended to gird Americans retiring now are already under considerable strain: Social Security is inadequately funded; defined benefit pension plans have all but disappeared; and the government’s insurance program meant to take over for failed defined benefit pension plans is itself under-capitalized.
“I do think there is a lot more uncertainty,” says Dara Smith, a litigation attorney for AARP. “Many workers are waiting longer to retire,” she says, either because they haven’t saved enough, are facing cost of living increases, haven’t yet recouped 2008 losses in their retirement funds, or need to hang onto their employer medical insurance.
“But people also want to work longer,” she says. “They just want to be productive and be employed longer.”
Adding to the uncertainty about what modern retirement looks like is the danger that a good swath of the population has come to believe that the current bull market is the new normal, says Christopher Geczy, Wharton adjunct finance professor and academic director of Wharton’s Jacobs Levy Equity Management Center for Quantitative Financial Research and of the Wharton Wealth Management Initiative.
“All these challenges are resonating against the background of a U.S. equity market that has reached new heights and in fact has extended the highest run for equities in history,” he says. “In addition, if you look at the pattern of attitudes toward risk, it’s been quite time-varying, and we know it’s time-varying especially for those in the youngest cohort, 35 and under. In fact, what we’ve seen in the data and received wisdom suggests, it looks like today young people have a higher risk aversion than people of the same age did in the late 1990s.”
So the question for many regarding preparing for retirement, he says, remains: “How are we going to get there?”
The Enduring Age of Age Discrimination
Just work longer. That’s the answer for a lot of workers who can’t afford to retire. Many, though, don’t have that option. Between 1992 to 2016, 56% of older workers reported being either laid off or pushed out of a job at least once, according to a study by ProPublica and the Urban Institute that analyzed data from the Health and Retirement Study. Only one in 10 workers reported earning as much in their new jobs as their old ones.
Even in a tight labor market, many employers want to get rid of older workers and are hesitant to hire older ones, says Peter Cappelli, management professor and director of Wharton’s Center for Human Resources.
What would it take for age discrimination to become a thing of the past?
“All these challenges are resonating against the background of a U.S. equity market that has reached new heights and in fact has extended the highest run for equities in history.”–Christopher Geczy
“It takes a belief among the leaders that this is a priority,” says Cappelli. “The odd thing is that executives who are themselves older may feel pressure to show that they do not fit the negative stereotypes of aging by being disproportionately negative about older candidates.”
Some of the interest in getting rid of older employees is because it saves more money, he says, “and some of it is because people who have been stuck in positions for a long time are bored and disengaged — those are also older. In hiring, though, none of that is an explanation.”
The bad news about age discrimination comes by way of recent court decisions that inexplicably conclude that protections against it do not apply to job seekers, only to current employees, Cappelli notes.
Protections for older workers were put into place long ago. The Age Discrimination in Employment Act of 1967 prohibits age discrimination against workers 40 and older, but a 2009 Supreme Court decision weakened that act, putting a higher level of burden on older workers to prove discrimination than on those claiming discrimination because of race, religion or gender.
Knowledge@Wharton High School
In situations where workers are being laid off to cut costs among the ranks of the higher paid, just because those workers happen to be older does not prove age discrimination, the Supreme Court has found.
“Culturally, we just don’t take age discrimination as seriously as other civil rights. People see it as an economic issue, not a civil rights issue,” says the AARP’s Smith. Stereotypes persist that older worker are checked out, slowing down or resistant to learning new skills. “Those assumptions are so baked in, and we see in this country the idea that younger workers should have their turn now.”
For older workers who may have been pushed out, it’s “very easy to blame yourself, to lose confidence,” says Stew Friedman, director of the Wharton Work/Life Integration Project and author of Total Leadership. But when considering a second act, it’s important to do an inventory of “what you know, what you’re good at, what you’ve accumulated in terms of the value you have,” he says. “One good way to do that is to talk to people who know you about what they see as your strengths. That can be really helpful and affirming. We know from research on social capital and leadership that the more you can reveal about who you are and the help you need, as well as what you can contribute, the easier it is for other people to be helpful to you. It starts with knowing what you need and being willing to ask for help. Nobody is going to hand it to you. At 55, you know that.”
Shaky Pillars of Retirement
If the timing and concepts around preparing for retirement are shifting, so are the financial tools for getting there. Workers in the U.S. saw the rise of various retirement innovations in the 20th century — Social Security, defined benefit plans, the now-ubiquitous 401(k) — and each has proven to have its vulnerabilities. One in three Americans has less than $5,000 in retirement savings, with one in five reporting no retirement savings at all, according to a 2018 Northwestern Mutual survey of more than 2,000 adults.
There is Social Security, but the system is threatened by a shortfall that currently exceeds $14 trillion in the next 75 years, and $43 trillion over the long haul, says Mitchell. Moreover, the Trust Fund will run dry in just 15 years, by 2034.
In her view, what’s needed to fix Social Security is a set of solutions sharing the burden across generations — reducing benefits, raising retirement ages and increasing taxes to pay for longer lives. “In fact, it’s actually more straightforward to restore Social Security to solvency than to fix Medicare, which is also running short of money,” says Mitchell. “Nevertheless, we still have to persuade the requisite number of politicians to go along with a reform package.”
This can be done, Mitchell argues, as it was done before. In 1983, she points out, “the system was three months from running out of cash to pay benefits, so it may take a cash crunch like that again, unfortunately.”
“Executives who are themselves older may feel pressure to show that they do not fit the negative stereotypes of aging by being disproportionately negative about older candidates.”–Peter Cappelli
At the same time, it’s no secret that defined benefit plans have dwindled. These pension plans in the U.S. peaked at more than 112,000 in 1985, declining to 47,000 in 1996 and to 25,607 by 2011, according to the Pension Benefit Guaranty Corp. Many of the remaining plans have obligations that far outstrip assets, and when they cease to be solvent their obligations may be taken over by the PBGC. The agency paid $5.8 billion to more than 861,000 retirees from 4,919 failed single-employer plans, and paid $153 million in financial assistance to 81 insolvent multi-employer plans, according to its 2018 annual report.
It claims responsibility for insuring the pensions of nearly 37 million people, whose benefits are valued at $3 trillion. But the PBGC’s own finances are underwater. The agency’s risk of insolvency is rising rapidly and is likely to occur by the end of FY 2025, according to the 2018 report.
The crisis is getting attention. Pension consultant David Blitzstein has written that the only hope would be a recapitalization of the PBGC with a minimum of $50 billion that would allow troubled plans to partition and spin off their “orphan” liabilities — the accrued liabilities of employers no longer contributing to the plans. Surviving plans might consider mergers, he wrote in a Wharton Pension Research Council post on Forbes.com.
One proposed piece of legislation, the Butch Lewis Act, recommends shoring up underfunded multiemployer pensions by lending them money at a low interest rate. Mitchell, though, calls this rescue plan “fatally flawed.” The act calls for the money to be repaid in 30 years with interest, but Mitchell says if the pension plan cannot do so, the bill permits loan forgiveness or refinancing of some as-yet-unforeseen obligation, leaving taxpayers on the hook. “A better solution would be to shut down this system now and deal with it today, while stopping the plans from underfunding further,” she says.
Another is the first substantial piece of retirement legislation in more than a decade. The Setting Every Community Up for Retirement Enhancement Act of 2019, or SECURE Act, was passed by the House and appears poised to clear the Senate at some point.
It would provide for tweaks in retirement law, but also some real changes. Among them: delaying the required minimum distribution to age 72 from the current 70½; making it easier for small employers to set up and offer 401(k) plans and allowing the creation of “open” Multiple Employer Plans; removing age limitations on IRA contributions; eliminating the 10% penalty tax to pay for a qualified birth or adoption; and opening up more options for annuities within retirement plans.
Annuities: Complex and Critical
This last change is being seen by many as the addition of an important tool in the transition to retirement, but not all annuities are created equal.
“It starts with knowing what you need and being willing to ask for help. Nobody is going to hand it to you. At 55, you know that.”–Stewart Friedman
“It makes sense as long as it’s optimal,” says Geczy about annuities, “but there is a lot of controversy about where and how and why, and that is because the annuities space is complex more generally and in some cases potentially more costly, although that definitely varies across products and features. But think about what you are asking for — for someone to give you in advance in essence a long-dated put contract or a hedge, and that can be a useful, if costly, proposition. The thing is, there is at some point annuitization, but most academics will tell you that at some point and in some form, it’s the optimal strategy for many or most investors.”
The vast majority of the act is positive, says David F. Babbel, Wharton professor emeritus, whose teaching and research at Wharton was split between the finance and insurance departments. The new rules regarding annuities are generally a good thing, he said, as annuities are the only financial products designed to provide income throughout one’s remaining lifetime. But the problem with annuities, he says, “is that they are long-term products that gradually erode in value if inflation picks up again. Even if the annuities include an escalation feature, these are usually pre-fixed and may not track the cost of living closely and, more importantly, an individual’s own cost of living,” he notes.
The erosion can be considerable. Babbel points out that if you look at every 20-year period since 1971, the dollar lost between 36% and 70% of its purchasing power by the end of the 20 years, depending on the period. This means that $10,000 per month at the outset of retirement would, 20 years later, have the purchasing power of only $3,000 to $6,400, depending on when you happened to retire.
“Looking to the future, the value erosion might be much less, but may even fall beyond these bounds,” he says.
Babbel advocates an innovative strategy to hedge against the rising cost of living needs by using what he calls a “staggered annuitization” (rather than the commonly understood concept of “laddered annuitization”) approach. He recommends putting a significant portion of one’s savings as one approaches retirement into a variety of deferred fixed annuities. At retirement, some are “activated” or annuitized to provide monthly income, while the others remain gaining value and are annuitized, as needed, depending on the rise in one’s own cost of living. While the deferred annuities are held in abeyance, they not only grow in tax-deferred value but each year as you age their payout rates per dollar of deferred value rise substantially. His personal approach is easy to implement, he says, and structured to guard against insolvency risk.
Of course, preparing for retirement also requires a certain amount of financial literacy, not to mention an awareness that the only constant is change — in legislation, retirement products, inflation rates, performance of the markets, and the economy.
“It’s actually more straightforward to restore Social Security to solvency than to fix Medicare, which is also running short of money.”–Olivia S. Mitchell
Many Americans may understand the general concept of shifting the balance of retirement assets as retirement draws near, but they have put much of their faith in target date funds that start out in a risk and growth mode at the beginning of a career and gradually shift to less risk approaching the draw-down phase. In 2018, assets of this kind in mutual funds and collective investment trusts had grown to more than $1.7 trillion, according to Morningstar.
But the “glidepath” approach only makes sense within a few years of retirement, say the authors of a March working paper for the Centre for Applied Macroeconomic Analysis at the Australian National University. Switching between assets and cash in a more frequent, systematic way may produce better results, according to “Absolute Momentum, Sustainable Withdrawal Rates and Glidepath Investing in U.S. Retirement Portfolios from 1925.”
Among the findings: “Smoothing the returns on individual assets by simple absolute momentum or trend following techniques is a potent tool to enhance withdrawal rates, often by as much as 50% per annum,” the paper states.
Can the average worker really be expected to approach preparing for retirement with such attention to detail?
“In the last two decades, the financial system has become disintermediated,” says Mitchell. “By that I mean that people must increasingly manage their own finances, instead of their employers handling their needs via health insurance and defined benefit pensions, or the government taking care of them. At the same time there has been substantial deregulation of financial products, and more complex financial products have come to market.”
As a result, plotting out one’s own retirement, she says, is getting tougher.
“People must increasingly manage their own finances, instead of their employers handling their needs via health insurance and defined benefit pensions, or the government taking care of them.”–Olivia S. Mitchell
And don’t expect robo-advisors to come to the rescue — at least, not anytime soon. Mitchell and Julie Agnew have a forthcoming volume on computerized financial advice models entitled The Disruptive Impact of FinTech on Retirement Systems. The book shows that services that use computer algorithms to provide financial advice and manage customers’ investment portfolios aren’t quite ready for retirement prime time yet.
“While many of these services try to help consumers save more or manage their budgets, they tend to ignore the fact that people have complex financial lives,” says Mitchell. “Does your partner have savings or a business? Do you need to put aside money for a disabled child? Additionally, few online financial algorithms help people spend down their money in retirement, or how to buy an annuity so as not to run out of money in old age. Fewer still tell you whether you should buy long-term care insurance, or whether to move to or out of a state that taxes your pension.”
Retirement, in the end, is as individualized as people. The answer? Says Mitchell: “Since retirement planning is so nuanced and complicated, it would behoove many to work longer, save more, and expect less.”
'연금시장' 카테고리의 다른 글
| 고령자가 더 오래 일해야하는 이유들 (0) | 2019.09.08 |
|---|---|
| 연금보험 선택이 줄고 인출프로그램 증가 (0) | 2019.08.13 |
| 은퇴위기는 과장되었다 (0) | 2019.07.22 |
| 퇴직연금 DB자산의 외부이전 확대 (0) | 2019.07.08 |
| 위험자산 비중을 늘렸던 연기금의 현실 (0) | 2019.05.10 |
글
부모 사망후 상속세를 8년후에 계산해도 되는 곳에서 벌어지는 일은?
사랑하는 부모님의 장례를 치른 후 상속관련된 세금을 곧장 내지 않고 8년 후(tax break)에 낸다면 어떨까요? 부모님이 구입했던 취득가액을 대상으로 여전히 주택소유세가 부가될테니 상속자산의 이전으로 재평가되어 재산세가 증가하지 않을 것이고, 다른 상속자산으로 인한 갑작스런 재산 증가로 이미 성인이 되어 있는 자녀들의 세율이 급등하지는 아닐겁니다.
부모님의 집에서 예전과 똑같이 거주하면서 상실의 아픔을 천천히 잊고 현실에 적응하겠죠? (물론 주택 소유자와 무주책자 간의 세대간 불평등성(generational inequities)은 더 커진다는 지적도 있습니다.) 세제당국의 취지는 그렇다고 하더라도 현실은 어떨까요?
캘리포니아가 이런 곳인데, 대다수 사람들은 부모님의 집에 거주하기도 하지만 다른 곳에서 거주하면서 부모님의 집은 렌트 주는 식으로 투자하는 친구들도 꽤 있다고 합니다. 정책을 펴는 조세당국의 취지와 그 영역 안에서 최적의 이득을 취하려는 참가자들의 입장은 확실히 다른 것 같습니다.
출처 : http://taxprof.typepad.com/taxprof_blog/2018/08/rich-
california-homeowners-pass-low-property-taxes-to-their-kids.html
Rich California Homeowners Pass Low Property Taxes To Their Kids
Los Angeles Times, California Homeowners Get to Pass Low Property Taxes to their Kids. It's Proved Highly Profitable to an Elite Group:
Actors Jeff and Beau Bridges, along with their sister, own a four-bedroom Malibu home with access to a semi-private beach and panoramic views of the Pacific Ocean. They inherited it from their mother, who had owned the house since the late 1950s when their father, Lloyd Bridges, first made it big in Hollywood.
Earlier this year, they advertised the “stunning Malibu dream” for rent at $15,995 a month — a hefty price tag for a house that has a property tax bill of less than half that.
Like other descendants of a generation of California homeowners, the Bridges siblings enjoy a significant perk that keeps their property tax bill low. Part of that is thanks to Proposition 13, which has strictly limited property tax increases since 1978. But they also benefit from an additional tax break, enacted eight years later, that extended those advantages to inherited property — even inherited property that is used for rental income.
California is the only state to provide this tax break, which was designed to protect families from sharp tax increases on the death of a loved one. Without it, proponents argued at the time it passed, adult children could have faced potentially huge bills, making it financially prohibitive to live in their family homes.
But a Los Angeles Times analysis shows that many of those who inherit property with the tax breaks don’t live in them. Rather, they use the homes as investments while still taking advantage of the generous tax benefits.
In Los Angeles County, as many as 63% of homes inherited under the system were used as second residences or rental properties last year, according to the Times’ analysis. ...
The inheritance tax break, The Times has found, has allowed hundreds of thousands — including celebrities, politicians, out-of-state professionals and some of California’s most prominent families — to avoid paying the higher taxes owed by newer homeowners. The tax break has deprived school districts, cities and counties of billions of dollars in revenue.
The Bridges siblings, who declined to comment for this article, would have paid an additional $300,000 in property taxes if the house had been reassessed when they inherited it in 2009, according to a Times calculation. In Los Angeles County, the tax benefit cost schools, cities and county government more than $280 million in revenue last year, the analysis shows.
One effect of Proposition 13 and the inheritance tax break has been to create generational inequities between those who have owned homes and those who haven’t. The laws place no limits on how many descendants can take advantage of the benefit, so future generations of Californians whose ancestors purchased houses decades ago will continue to pay property taxes based on values established in the 1970s.
The laws have helped many families stay in their homes without onerous tax burdens. But soaring property values across California also have created windfalls for longtime homeowner families that even the biggest backers of these laws didn’t expect. ...
To receive the benefit, it isn’t even necessary to live in California. An attorney in Boca Raton, Fla., has advertised the two-bedroom Santa Monica home he inherited from his parents near the Brentwood Country Club for $5,900 a month, which would pay his annual property taxes in a little more than two weeks. ...
In Malibu, Hollywood Hills and Playa del Rey, more than 80% of owners report their inherited property is not their primary residence, according to The Times’ analysis. Families who have owned property the longest are also more likely to rent the houses out or use them as second residences, the records show. In L.A. County, three-fourths of heirs whose parents owned homes at the time of Proposition 13’s 1978 passage don’t report the property as their primary home, The Times found.
The tax privileges afforded current homeowner families stand in contrast to the higher taxes many newcomers face. The Bridges children had a $5,700 tax bill last year for their Malibu home now estimated by Zillow to be worth $6.8 million. If someone bought the home at that price today, they’d pay more than $76,000 annually in property taxes.
'보험영업' 카테고리의 다른 글
| 세계에서 가장 수명이 긴 나라는 일본이 아니라 스페인! (0) | 2018.11.18 |
|---|---|
| 감독원, 변액연금 상품안내장 간소화 허가 (0) | 2018.11.06 |
| 수명증가 추세가 처음으로 둔화되었습니다 (0) | 2018.08.13 |
| 빅데이터 활용을 통한 보험사기 적발과 거액 보험금 발생 예측 (0) | 2018.08.07 |
| 보험료가 저렴해진다면 개인정보를 보험회사에 기꺼이 넘긴다 (0) | 2018.06.22 |
글
미보고발생손해액, IBNR의 처음과 끝
미보고발생손해액...IBNR 준비금을 계산할 때 어떻게 어떤 모델을 쓸것인가 등에 대해서 정의하고 모델구성하고 예제달고 평가하고... a부터 z까지 정리해 놓았다.
출처 : http://theactuarymagazine.org/anticipating-events/
Anticipating Events
Using member-level predictive models to calculate IBNR reserves June/July 2018
Predictive models have the potential to transform many aspects of traditional actuarial practice and change the way actuaries manage and think about risk. One common actuarial task where modern predictive models are not commonly used is the calculation of incurred but not reported (IBNR) reserves. Rather, IBNR has historically been calculated for pools of members using aggregate methods that utilize high-level assumptions without any sophisticated consideration of the risk factors of the individual members within the pool. However, by incorporating these risk factors into a predictive model, there is the potential to develop an informative alternative to the traditional actuarial approach. In this article, we’ll consider how a predictive model might be built to estimate IBNR at the member level. To demonstrate its efficacy, we’ll consider a case study from the group health care market.
IBNR Defined
Let’s first define what IBNR is. Essentially, IBNR is an estimate of the amount of claim dollars outstanding for events that have already happened but have not yet been reported to the risk-bearing entity.1 For instance, if you break your arm and go to the emergency room, you will generate a claim on that date. Until you (or your provider) report that claim, your insurance company does not know about it. However, your insurance company is still liable for the claim. In fact, the risk-bearing entity is responsible for all incurred and unreported claims like this across its pool, and so it must set funds aside in its financial statements for the estimated amount of these payments. The challenge here is obvious: Because the insurance company doesn’t even know that you’ve gone to the hospital, the IBNR reserves held on its financial statement will always need to be estimated.
Traditional actuarial methods for IBNR estimation have many flavors, but they have largely revolved around aggregate estimations for entire pools of members. One traditional actuarial method, which we’ll refer to as the completion factor method, looks at the claims already received and estimates what percentage of incurred claims are believed to already be reported. This value is our completion factor. With an estimate of the total incurred claim cost, then the calculation of IBNR is as straightforward as subtracting the claims already reported from the total incurred claim costs, as shown in Figure 1. All the science and art of this method of IBNR estimation revolve around deriving good estimates for how complete the claims are for a given month.
| Figure 1: Application of Completion Factor Method to Estimate IBNR | ||||
|---|---|---|---|---|
| A | B | C = A / B | D = C–A | |
| Incurred Month | Claims Reported to Date | Assumed Completion Factor | Estimated Final Incurred Claims | IBNR |
| December 2017 | $1,000,000 | 40.0% | $2,500,000 | $1,500,000 |
| November 2017 | $1,200,000 | 60.0% | $2,000,000 | $800,000 |
| October 2017 | $900,000 | 90.0% | $1,000,000 | $100,000 |
| September 2017 | $1,000,000 | 100.0% | $1,000,000 | $0 |
An alternative actuarial approach, which we’ll refer to as the projection method, is to estimate the average incurred claim cost per member with no consideration of the amount of claims already reported. This is typically done by using the average incurred claim costs per member from a time period that is assumed to be 100 percent complete (or close to complete).2 With an estimate of the total incurred claim cost per member in hand, we merely need to take the difference between this value and the average amount of the claims already reported per member to get the IBNR expressed on a per-member basis. Multiplying this value by the total number of members in the pool gives us our final IBNR estimate.
The projection method is a common approach for very recent months, and it relies on the assumption that the claims that have been reported to date in those recent months are not a good predictor of total incurred claims. The completion factor method is more common in months where the claim payments are assumed to be more mature.
Why Use Predictive Models at the Member Level?
Traditional methods like the previous example are technically predictive models, but they treat all individual risks the same. The benefit of such an approach is its simplicity and tractability. However, the underlying assumption that every person in the pool has the same historical payment pattern and propensity to have incurred and unreported claims seems unlikely.
An alternative to these traditional methods is to use predictive models at the member level. One of the strengths of predictive models is their ability to take high-dimensional data sets within which to segment and attribute risk more accurately, while appropriately handling any complex relationships between our prediction and the variables the model uses to make that prediction. Instead of relying upon aggregate completion patterns, predictive models can estimate IBNR for each member directly. These member-level IBNR predictions can then be summed together into an aggregate reserve amount for an entire employer group or pool of business.
Why use predictive analytics in this fashion? The biggest potential gain is in the accuracy of the estimate. IBNR can fluctuate wildly, particularly for small groups or payers with unstable payment patterns, and any additional pickup in predictive power can be helpful in estimation. An additional drawback of traditional methods is that it can often be difficult to develop IBNR estimates for different subpopulations. For instance, suppose you work at a small insurance company and you are interested in reviewing the incurred claims by month, including IBNR, for individually insured members ages 55 to 64 in a particular geographic region. Using a traditional approach, there would be two options:
- Develop an IBNR estimate based on payment patterns observed specifically for this cohort. This involves additional effort, and the credibility of the estimates could be a concern if the population is small.
- Apply completion factors developed from a larger pool of members. This approach is simpler, but it can also be problematic if the underlying payment pattern for this cohort is different from the larger pool.
Predictive analytics methods applied at the member level can solve this challenge by leveraging the credibility of the entire pool of members while accurately reflecting the risk characteristics embedded within any slice of the data. By producing estimates for each individual member, the estimates can be aggregated to any desired level.
The added sophistication of member-level predictive models is not free. Generally, estimating IBNR using aggregate methods can be done in a spreadsheet application after doing some data preprocessing in a language of your choice. The minimum data requirements for the completion factor method are simply a summary of claims paid for each combination of incurred month and reported month in the historical period (known as a lag triangle). Building predictive models at the member level is more demanding. First, you need to capture all the data elements required for your predictive model that perhaps you weren’t capturing at the individual level before (demographics, geography, risk scores, etc.). Second, you need to manipulate this larger data set into a format that can be fed into modeling software. Once the data is ready, you need to actually be scoring all these members on a platform capable of making predictions using a predictive model before finally aggregating and interpreting results.
Case Study: Our Model Building Approach
To assess the potential benefits of using predictive analytics to calculate IBNR at the member level, we performed an illustrative case study from a large, multiple-payer data set for 10 different employer groups ranging in size from approximately 400 to 7,000 members. In our evaluation, we looked at the performance of two popular machine learning methods: penalized regression and gradient boosting decision trees.3
We built separate models for each incurred month. For instance, one model was strictly focused on predicting IBNR in the most recent month, while a separate model was focused on predicting IBNR in the previous month. To train the models, we included a rich variety of features, including historical payment information (by incurred month and paid month), as well as demographic and clinical information such as age, gender and risk score. We also included some “leading indicator” features that helped the model identify potential large payments that had been incurred. For instance, one of these features indicated that a member had incurred a professional claim at an inpatient or outpatient facility during a given month, yet no facility claim had been reported for that month. During a hospital visit, there are typically separate bills from the facility and from the physician (or physicians). The physician (professional) bill is often processed more quickly and is generally much less expensive than the facility bill. The presence of only the professional bill is a strong indicator that there is a large claim that is yet to be reported.
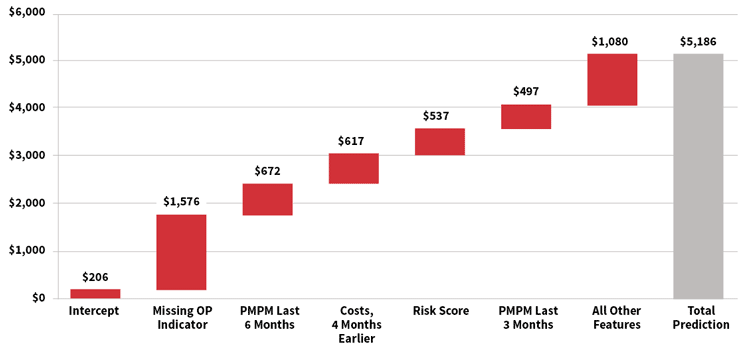
For many modern machine learning algorithms, the relationships between features and predicted values can be complex. The waterfall chart in Figure 2 is a representation of the prediction development for a single member’s IBNR estimate for the most recent month, using a gradient boosting machine. For this member, the model started with a baseline estimate of $206, but this increased by approximately $1,576 as a result of the member having a “missing outpatient claim” (as described earlier). Other features pushed the prediction even higher, including high monthly costs over the past six months and a high risk score. Ultimately, the model predicted an IBNR of $5,186 for this member.
Figure 2: Illustration of Predicted IBNR for Individual Member, Gradient Boosting Machine
Case Study: How Accurate Were Our Models?
To keep our case study simple, our models only predicted claims that were incurred within the three months prior to the valuation date because these months constitute the bulk of the reserve. To evaluate the accuracy of our models, we split the data into two sets: a training set and the testing set. The model was built on the training set while the testing set was withheld for model evaluation and to ensure we weren’t overfitting.
To estimate overall performance, we compared the 10 group-level models for each algorithm to two traditional methods. We then compared the predicted results to the actual IBNR for each method or model, and we calculated the aggregate error across all groups, the average absolute percentage error for each group, and the standard deviation of the percentage error across the groups. These values can be seen in Figure 3. Overall, the gradient boosting decision tree model and the penalized regression model estimated the overall IBNR more accurately and had less variation than the traditional methods. These results suggest that predictive models have the potential to increase the accuracy of reserve estimates. We also found that the member-level predictions from the predictive models generally had a 30 percent to 50 percent correlation with actual results, compared with 20 percent to 30 percent when applying the group-level completion factors to individual members. The member-level correlation statistics are more complicated to aggregate across groups and lag months, so we excluded them from Figure 3.
| Figure 3: Error Metrics for Traditional Methods and Predictive Models | |||
|---|---|---|---|
| Traditional Methods | Aggregate Percentage Error | Average Absolute Percentage Error | Standard Deviation |
| Completion Factor | –3.6% | 42.8% | 72% |
| Projection Method | 8.3% | 43.2% | 47% |
| Predictive Models | |||
| Gradient Boosting Decision Tree |
1.4% | 24.8% | 29% |
| Penalized Regression | –0.1% | 27.1% | 34% |
Considerations
Using predictive analytics for the estimation of IBNR does not mean that actuarial judgment is no longer needed. Beyond the expertise needed in crafting the models themselves, adjustments to IBNR should still be made outside the model or as offsets within the modeling process. These adjustments can include handling new entrants without historical data, claim trends, or any staffing or technological considerations that could impact the backlog of claims.
One of the most important considerations in building a predictive model is which variables to include. Most of the increases in predictive power will not come from more powerful or refined techniques, but rather from more carefully considered and richer input data. For health care, some more obvious variables to consider (when available) are age, gender, plan design and geography of the member. In addition, the temporal nature of IBNR makes the timing of when things happen a key consideration. In designing variables for the model, this should be exploited where possible. For instance, the reporting of less expensive drug claims may precede more expensive inpatient and outpatient claims, or high claims in a prior period may indicate more claims are still outstanding.
Given enough feature creation and enough volume of data, a well-crafted predictive model should be able to discern the most pertinent relationships. As an example of some possible relationships a predictive model might uncover, consider Figure 4. In the first table, we see two variables and their joint impact on the IBNR within our case study (for simplicity we are only considering the amount of unreported claims in the month prior to the valuation date and paid within the next month, which we denote L0). The first variable is the member’s average monthly claims over the past year. The other variable is the “missing inpatient” indicator discussed earlier. Similarly, in the second table in Figure 4, we see another joint relationship that can stratify risk. This time the relationship is between the claims already paid in L0 and the risk score of the member.
| Figure 4: Average IBNR in Lag 0 by Certain Key Features | |||
|---|---|---|---|
| Missing IP Indicator | |||
| Prior Year’s Claims PMPM | Yes | No | |
| $0–$200 | $12,612 | $92 | |
| $200–$400 | $10,152 | $316 | |
| $400–$600 | $15,103 | $391 | |
| $600–$800 | $14,302 | $473 | |
| $800–$1,000 | $17,017 | $530 | |
| $1,000–$10,000,000 | $19,831 | $1,545 | |
| Risk Score | ||||
| Claims Paid in L0 | 0–0.5 | 0.5–1.0 | 1.0–2.0 | 2.0+ |
| $0–$1,000 | $98 | $157 | $217 | $757 |
| $1,000–$2,500 | $1,591 | $1,595 | $2,408 | $5,374 |
| $2,500–$10,000 | $2,170 | $2,492 | $2,029 | $8,361 |
| $10,000–$10,000,000 | $2,231 | $2,934 | $4,954 | $16,225 |
The values shown in each cell represent the average observed IBNR for the most recent incurred month in our training data. As we can see in each chart, these variables are all strongly correlated with IBNR, but together we can stratify the risk more accurately than we can in isolation.
Before involving predictive models in your reserving process, many practical considerations are involved. The first and foremost should be a good understanding of the problem you are hoping to solve. While we mention two possible benefits to using predictive models—increased accuracy of the estimates and more accurate IBNR attribution to individual members within the pool—these benefits may not hold in all cases, depending on the availability of data and the line of business. For a list of potential considerations, see Figure 5.
| Figure 5: Practical Considerations Before Using Predictive Models for IBNR |
|---|
|
One thing to keep in mind is that member-level predictive models need not completely replace traditional actuarial methods to be valuable. In fact, the completion factor method and the projection method described are often blended in practice. IBNR estimates created by member-level predictive models can be similarly blended with any traditional approach. They could also be used not for the results directly, but instead as a way to help understand the drivers of changing IBNR values. Regardless, until enough comfort and sophistication with predictive models is established, the most prudent course of action for any actuary is to do rigorous back-testing and results monitoring before replacing any traditional methods.
Conclusion
Overall, our findings indicate that using predictive models for IBNR estimation is promising. However, our analysis is not definitive; given the volatility in IBNR estimates and the sample size we tested, further research is warranted before concluding that predictive modeling techniques are superior to traditional methods. However, predictive analytics methods need not completely supplant traditional IBNR methods to be valuable. Instead, and more likely, the two approaches can supplement and complement each other. What our analysis does suggest is that this is a productive endeavor to explore. By incorporating predictive models into traditional actuarial methods we might not find the crystal ball that we seek, but with the steady incremental improvements it allows us, we can help advance actuarial practice.
References:
- 1. This differs slightly from incurred but not paid (IBNP) reserves, which would also include claims that have been reported but not yet paid. Throughout this article we use the term IBNR, although the same approach could be applied to IBNP reserves.
- 2. Actuaries often make additional adjustments to this historical cost, including applying an assumed trend and adjusting for seasonality or the number of working days per month.
- 3. James, Gareth, Daniela Witten, Trevor Hastie, and Robert Tibshirani. 2013. An Introduction to Statistical Learning: With Applications in R. New York: Springer.
'보험계리' 카테고리의 다른 글
| 국제회계기준 도입을 2년만 늦춰 주세요 (0) | 2018.10.22 |
|---|---|
| 미국에서 가장 핫한 대학 전공은 보험계리학 (0) | 2018.09.16 |
| 보험회사 자기자본 규제 강화로 25% 퇴출 (0) | 2018.07.24 |
| 대학졸업후 연봉 1억원 이상 받는 직업, 보험계리사 (0) | 2018.07.15 |
| 맨섬 금융감독원이 손보사의 새로운 지급여력제도 도입을 연기 (0) | 2018.04.07 |